Bandhan Innovation Fund - Regular Plan - Growth
| Category: Equity: Thematic-Innovation |
| Launch Date: 30-04-2024 |
| Asset Class: |
| Benchmark: NIFTY 500 TRI |
| Expense Ratio: 2.05% As on (31-07-2025) |
| Status: Open Ended Schemes |
| Minimum Investment: 1000.0 |
| Minimum Topup: 1000.0 |
| Total Assets: 1,682 Cr As on (31-07-2025) |
| Turn over: - |
12.983
0.04 (0.3081%)
20.98%
NIFTY 500 TRI 12.41%
PERFORMANCE of Bandhan Innovation Fund - Regular Plan - Growth
Scheme Performance (%)
Data as on - 02-09-2025Yearly Performance (%)
Fund Managers
Mr. Manish Gunwani, Mr. Prateek Poddar, Mr. Brijesh Shah
Investment Objective
The Scheme seeks to generate long-term capital appreciation by investing predominantly in equity and equity-related instruments of companies following innovation theme.
MONTHLY LUMPSUM RETURNS ( Invested amount 1,00,000)
| NAV Date | NAV | Units | Market Value |
Returns (%) |
|---|---|---|---|---|
| 02-05-2024 | 10.064 | 9936.407 | 100000 | 0.0 % |
| 03-06-2024 | 10.281 | 9936.407 | 102156 | 2.16 % |
| 02-07-2024 | 11.123 | 9936.407 | 110523 | 10.52 % |
| 02-08-2024 | 11.809 | 9936.407 | 117339 | 17.34 % |
| 02-09-2024 | 12.323 | 9936.407 | 122446 | 22.45 % |
| 03-10-2024 | 12.738 | 9936.407 | 126570 | 26.57 % |
| 04-11-2024 | 12.334 | 9936.407 | 122556 | 22.56 % |
| 02-12-2024 | 12.733 | 9936.407 | 126520 | 26.52 % |
| 02-01-2025 | 13.081 | 9936.407 | 129978 | 29.98 % |
| 03-02-2025 | 11.66 | 9936.407 | 115859 | 15.86 % |
| 03-03-2025 | 10.49 | 9936.407 | 104233 | 4.23 % |
| 02-04-2025 | 11.349 | 9936.407 | 112768 | 12.77 % |
| 02-05-2025 | 11.554 | 9936.407 | 114805 | 14.8 % |
| 02-06-2025 | 12.349 | 9936.407 | 122705 | 22.71 % |
| 02-07-2025 | 12.699 | 9936.407 | 126182 | 26.18 % |
| 04-08-2025 | 12.785 | 9936.407 | 127037 | 27.04 % |
| 02-09-2025 | 12.983 | 9936.407 | 129004 | 29.0 % |
| 03-09-2025 | 13.084 | 9936.407 | 130008 | 30.01 % |
RETURNS CALCULATOR for Bandhan Innovation Fund - Regular Plan - Growth
Growth of 10000 In SIP (Fund vs Benchmark)
Growth of 10000 In LUMPSUM (Fund vs Benchmark)
Rolling Returns
Rolling returns are the annualized returns of the scheme taken for a specified period (rolling returns period) on every day/week/month and taken till the last day of the duration. In this chart we are showing the annualized returns over the rolling returns period on every day from the start date and comparing it with the benchmark. Rolling returns is the best measure of a fund's performance. Trailing returns have a recency bias and point to point returns are specific to the period in consideration. Rolling returns, on the other hand, measures the fund's absolute and relative performance across all timescales, without bias.
Market Cap Distribution
Small Cap
44.58%
Others
1.01%
Large Cap
34.71%
Mid Cap
19.56%
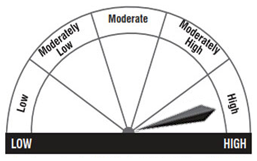
Riskometer
Key Performance and Risk Statistics of Bandhan Innovation Fund - Regular Plan - Growth
| Key Statistics | Volatility | Sharpe Ratio | Alpha | Beta | Yield to Maturity | Average Maturity |
|---|---|---|---|---|---|---|
| Bandhan Innovation Fund - Regular Plan - Growth | - | - | - | - | - | - |
| Equity: Thematic-Innovation | - | - | - | - | - | - |
PEER COMPARISION of Bandhan Innovation Fund - Regular Plan - Growth
| Scheme Name | Launch Date |
1-Year Ret (%) |
2-Yrs Ret (%) |
3-Yrs Ret (%) |
5-Yrs Ret (%) |
10-Yrs Ret (%) |
|---|---|---|---|---|---|---|
| Bandhan Innovation Fund - Regular Plan - Growth | 30-04-2024 | 5.36 | 0.0 | 0.0 | 0.0 | 0.0 |
| Kotak Pioneer Fund- Regular Plan- Growth Option | 31-10-2019 | 5.16 | 23.03 | 21.6 | 23.27 | 0.0 |
| Union Innovation & Opportunities Fund - Regular Plan - Growth Option | 06-09-2023 | 2.8 | 0.0 | 0.0 | 0.0 | 0.0 |
| ICICI Prudential Innovation Fund - Growth | 05-04-2023 | 2.04 | 25.62 | 0.0 | 0.0 | 0.0 |
| Axis Innovation Fund - Regular Plan - Growth Option | 05-12-2020 | 0.92 | 17.44 | 14.94 | 0.0 | 0.0 |
| Nippon India Innovation Fund-Regular Plan-Growth Option | 29-08-2023 | -1.09 | 19.89 | 0.0 | 0.0 | 0.0 |
| Baroda BNP Paribas Innovation Fund Regular plan - Growth Option | 05-03-2024 | -2.77 | 0.0 | 0.0 | 0.0 | 0.0 |
| SBI Innovative Opportunities Fund - Regular Plan - Growth | 05-08-2024 | -3.71 | 0.0 | 0.0 | 0.0 | 0.0 |
| UTI Innovation Fund - Regular Plan - Growth Option | 13-10-2023 | -9.08 | 0.0 | 0.0 | 0.0 | 0.0 |
PORTFOLIO ANALYSIS of Bandhan Innovation Fund - Regular Plan - Growth
Asset Allocation (%)
| Allocation | Percentage (%) |
|---|